Mastering the Product-Market Matrix: Strategies for Business Success
You don’t grow by accident. You grow by design.
The Product–Market Matrix is your design language. Use it right and you’ll stop guessing where to place bets, when to harvest, and what to kill. Use it incorrectly, and you’ll continue to burn cash on “pet projects” while your competitors make money.
This guide provides a concise, founder-friendly system for selecting growth plays, allocating resources, and testing focus, utilizing the Ansoff Matrix (first published in the Harvard Business Review in 1957) and the BCG Growth–Share Matrix (which determines where to place your chips). You’ll also get working definitions for every “matrix” people throw around at meetings, plus practical templates you can use this quarter.
Quick Definitions (so we’re speaking the same language)
A Business manager utilizes frameworks like the Product-Market Matrix to guide company growth and assess risks.
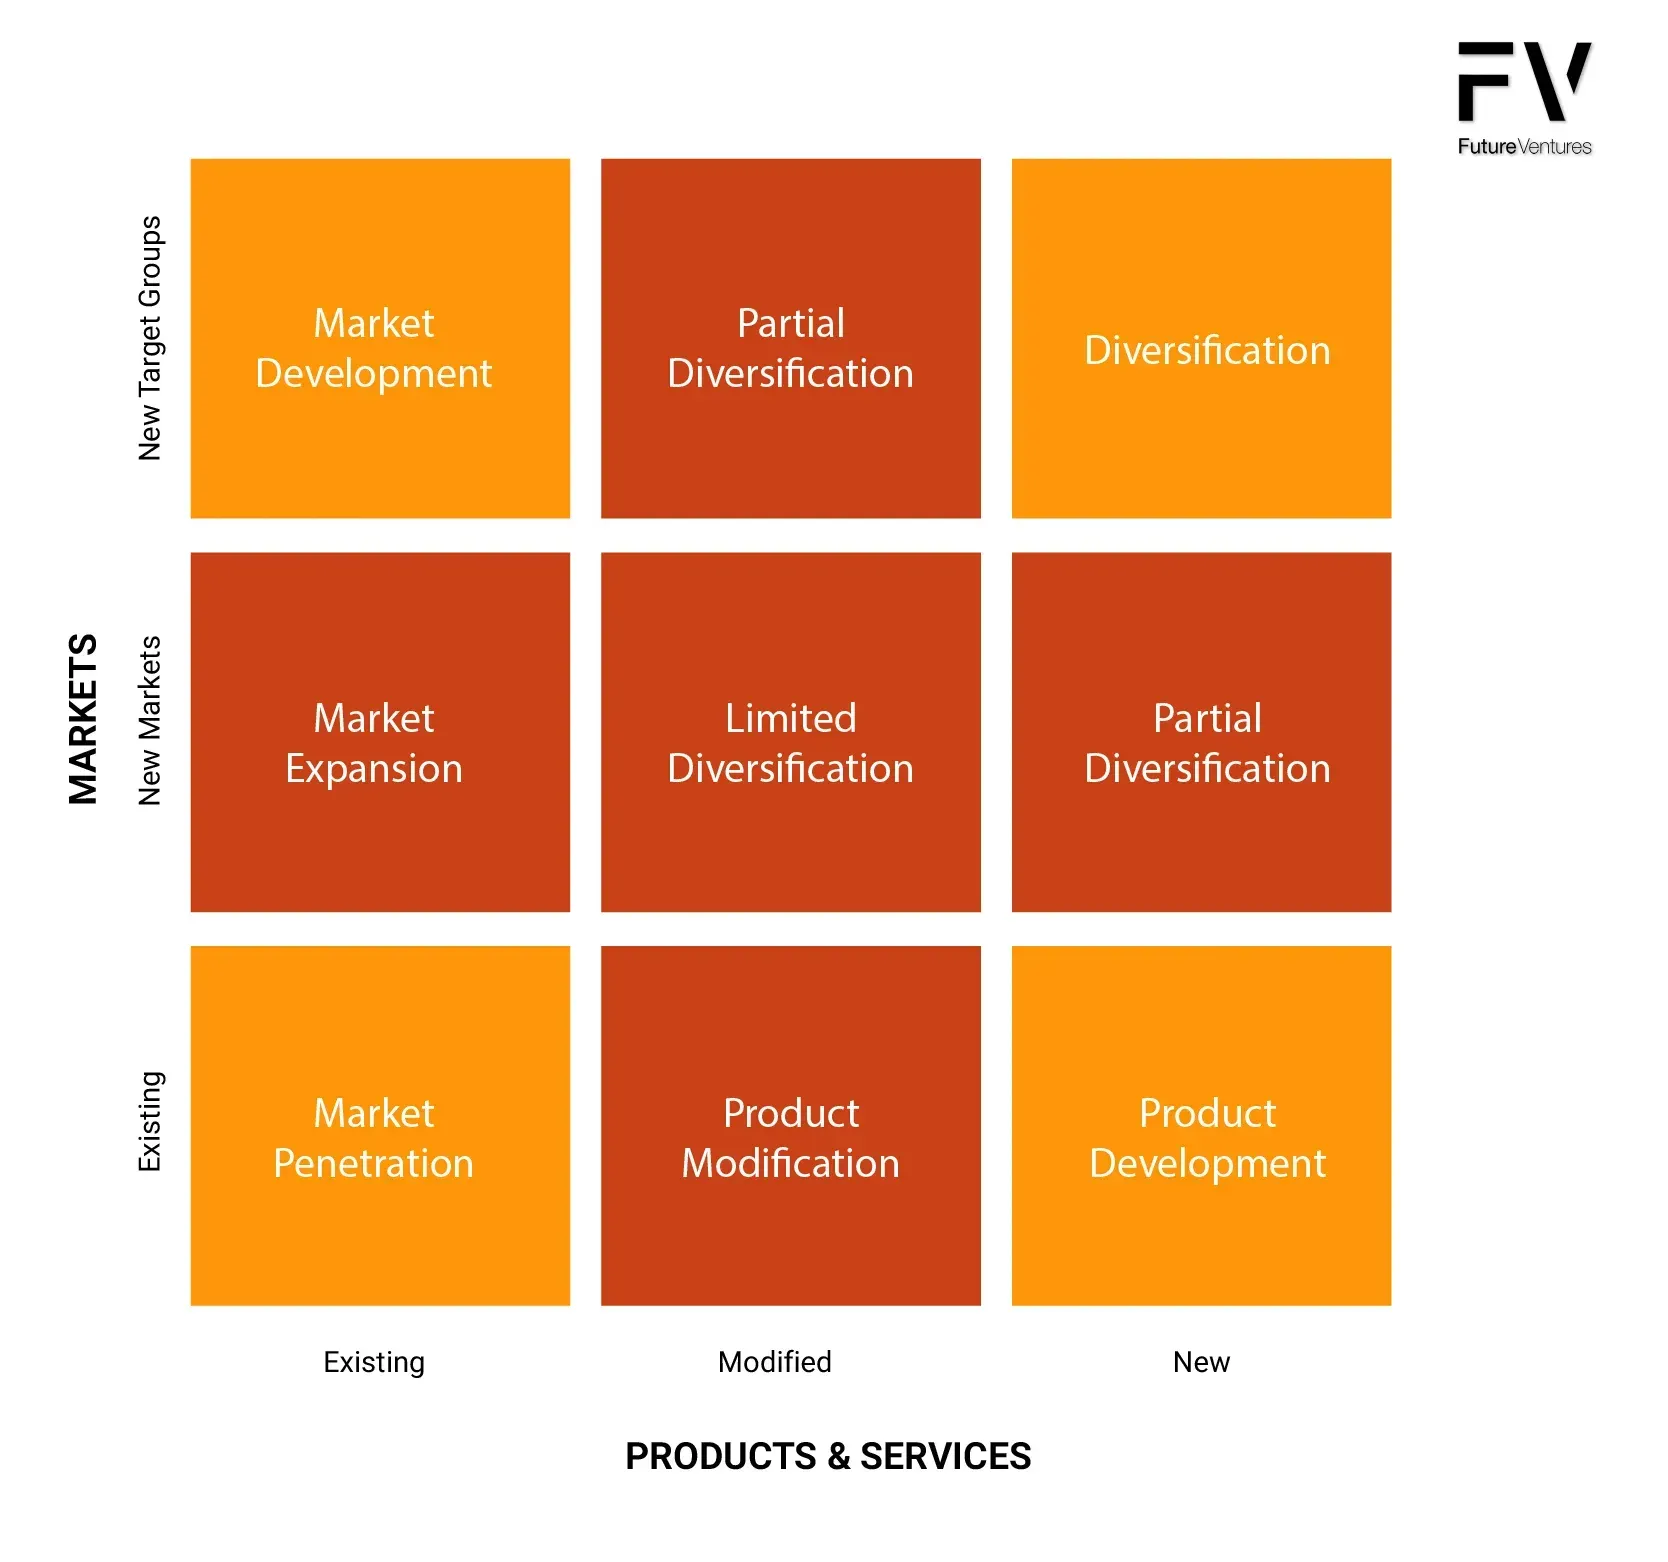
- Product–Market Matrix (general): A 2×2 that maps Products (existing/new) against Markets (existing/new). This is the Ansoff Matrix—the classic framework for selecting growth strategies. The Ansoff Matrix was developed by H. Igor Ansoff in 1957 and remains a foundational tool in strategic planning.
- Product Matrix: A table of your product lines/SKUs vs. key attributes (features, price tiers, personas, use cases). You use it to rationalize the portfolio, spot gaps, and avoid duplicate builds.
- Market Matrix: A table of markets/segments vs attractiveness and your position (e.g., TAM, growth, margin, regulation, competitive intensity). Often implemented as a nine-box (GE–McKinsey), but can be simpler. It’s an input to focus.
- Product–Market Focus Matrix: A grid of product lines vs. target segments with a focus decision in each cell: Invest / Hold / Harvest / Exit (and owner, KPI, budget). This operationalizes strategy into resourcing.
- BCG Product–Market Growth (Growth–Share) Matrix: A 2×2 that maps each business unit/product by Relative Market Share (x-axis) vs. Market Growth Rate (y-axis) to guide capital allocation: Stars, Cash Cows, Question Marks, Dogs. Diversification entails entering new markets with new products and has the highest risk, making it a critical consideration in portfolio management.
Part I. The Ansoff Matrix: Your Menu of Growth Strategies
Purpose: decide how you’ll grow - by penetrating, developing, building, or diversifying. When using the Ansoff Matrix, it is crucial to evaluate risks associated with each growth strategy and develop contingency plans to address potential challenges.
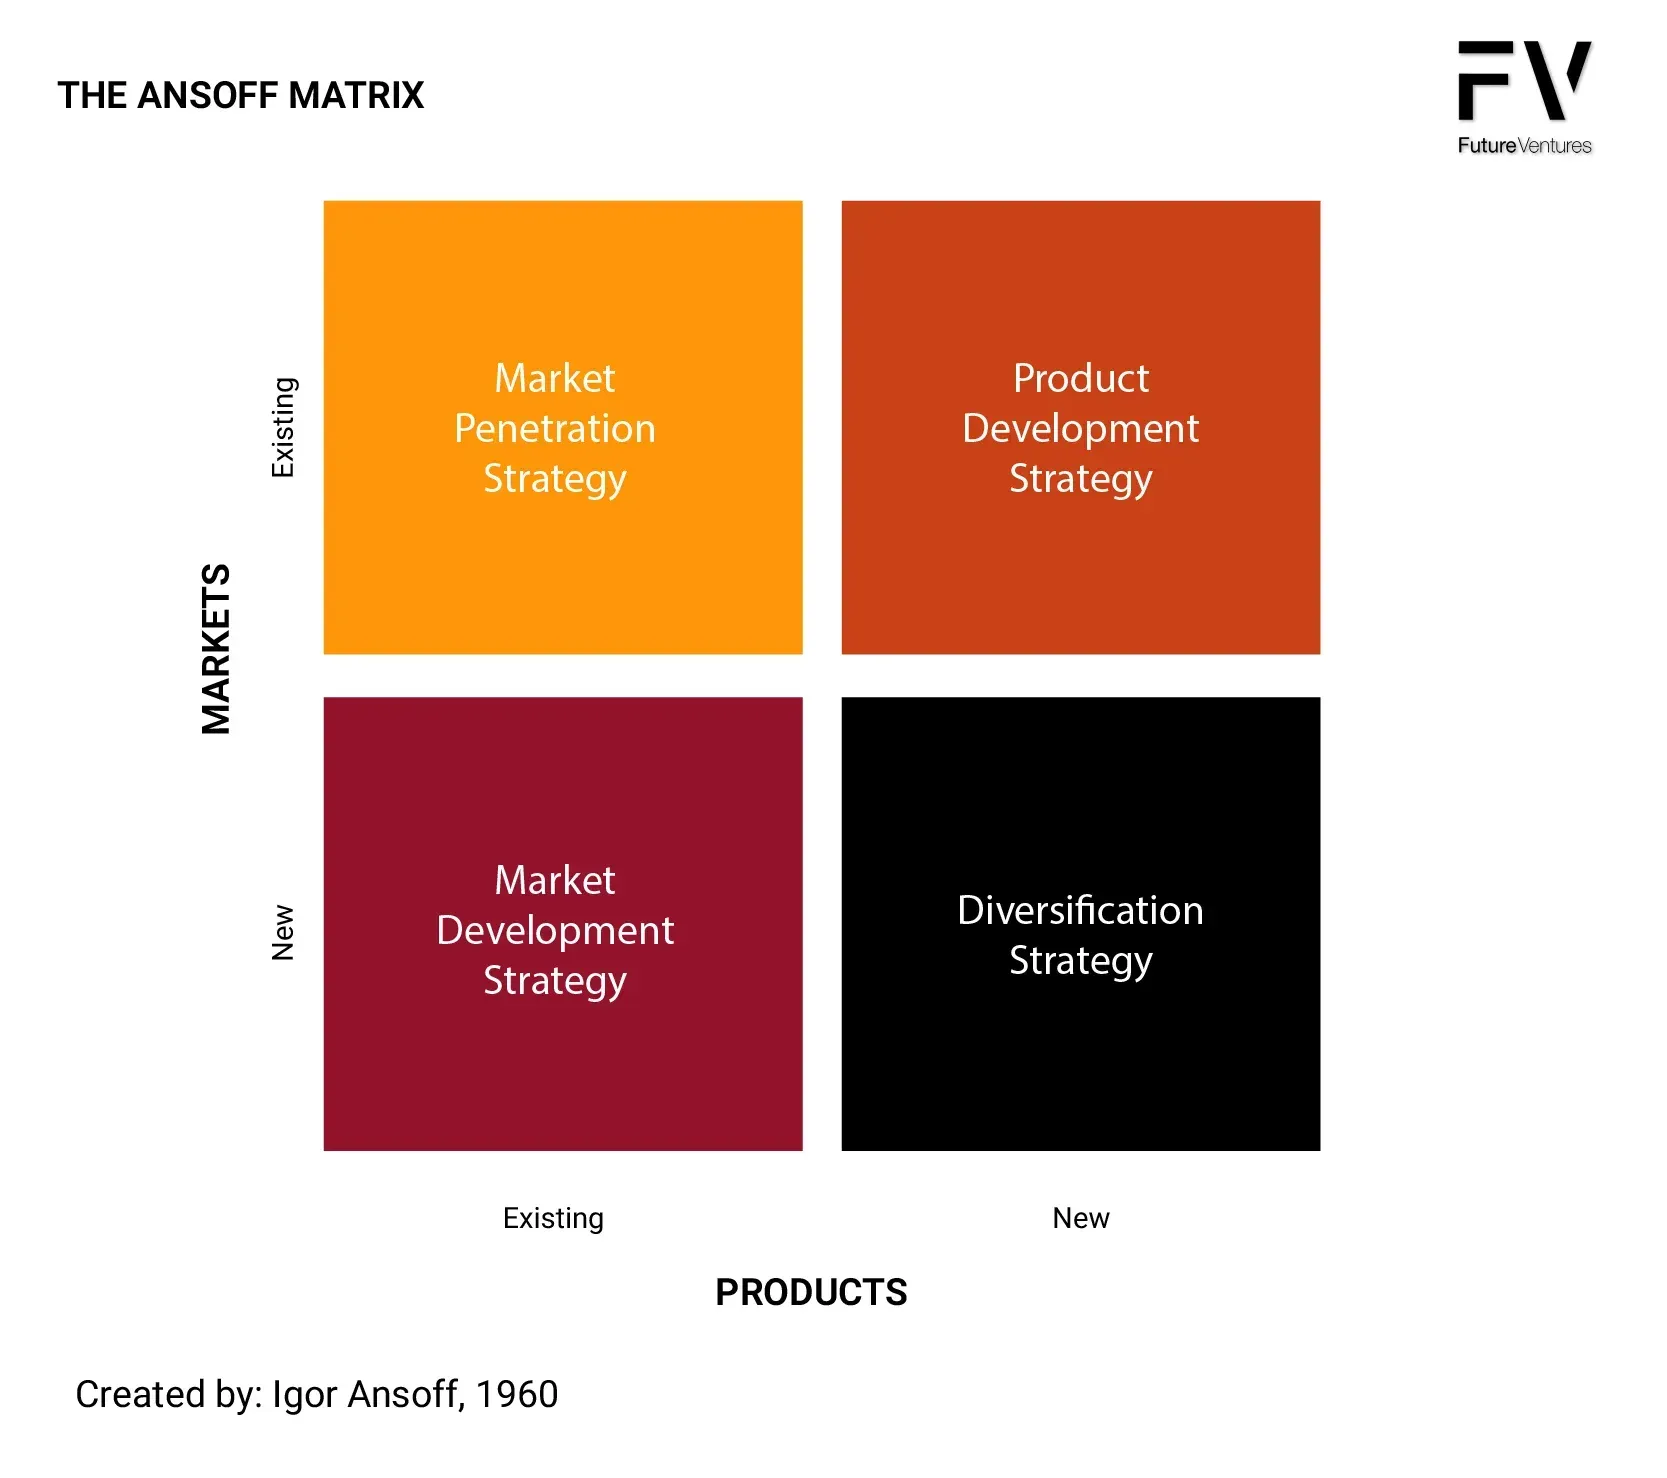
The Four Plays (risk rises as you move right and down)
1.Market Penetration (Existing Product × Existing Market)
- Goal: Capture market share fast.
- Levers: Pricing, promos, distribution, product-led growth, referral mechanics, bundling, better onboarding. A strong marketing strategy focused on increasing sales of existing products within current markets can help grow market share with relatively low risk.
- When to use: You see underserved users, weak incumbents, high switching, or low awareness.
- Watch-outs: Discount addiction, CAC creep, channel conflict.
2.Product Development (New Product × Existing Market)
- Goal: Increase ARPU/LTV from existing customers. A product development strategy is key to increasing customer value and testing market response to new technologies.
- Levers: Add adjacent features, premium tiers, services, accessories, and data products. Leveraging your existing customer base allows you to expand product offerings and increase profits by targeting loyal customers with new solutions.
- When to use: Clear unmet needs, strong brand trust, and an identifiable upsell path.
- Watch-outs: Feature bloat, internal cannibalization, split focus.
- Market Development (Existing Product × New Market)
- Goal: Copy-paste what works to new segments/geos. Provides strategic focus by helping identify the most promising market segments and guiding your approach to entering new markets with existing products.
- Levers: new geographies, new verticals, new channels/partners, new ICPs. Identifying and understanding the target market is critical when entering new segments or geographies to ensure product-market fit and effective go-to-market strategies.
- When to use: product travels well; low localization; repeatable GTM motion.
- Watch-outs: underestimating localization, regulatory friction, and channel ramp times.
3.Diversification (New Product × New Market)
- Goal: Build a second engine.
- Levers: M&A, corporate venture building, platform extensions, hardware-to-software or vice versa. Related diversification involves expanding into markets or industries related to your current business, such as a software company launching a new app for an adjacent user base. Unrelated diversification refers to entering completely different and unrelated industries, such as a software company launching a food delivery service. Related diversification typically carries less risk than unrelated diversification.
- When to use: You have a real strategic edge (in distribution, data, brand, or technology) and a tolerance for long payback periods.
- Watch-outs: Shiny-object risk, culture drift, capital drain.
Action template (mobile-friendly):
- Your ICP now: [role, company size, industry, job-to-be-done]
- Unmet need: [evidence]
- Chosen Ansoff Play: [penetration/product dev/market dev/diversification]
- 90-day moves: [3–5 actions]
- Hard KPI: [CAC payback, net revenue retention, geo pipeline, attach rate]
- Kill-criteria: [what triggers a stop]
Part II. The BCG Growth-Share Matrix: Your Capital Allocation Engine
Purpose: decide where to put money this year across your portfolio.
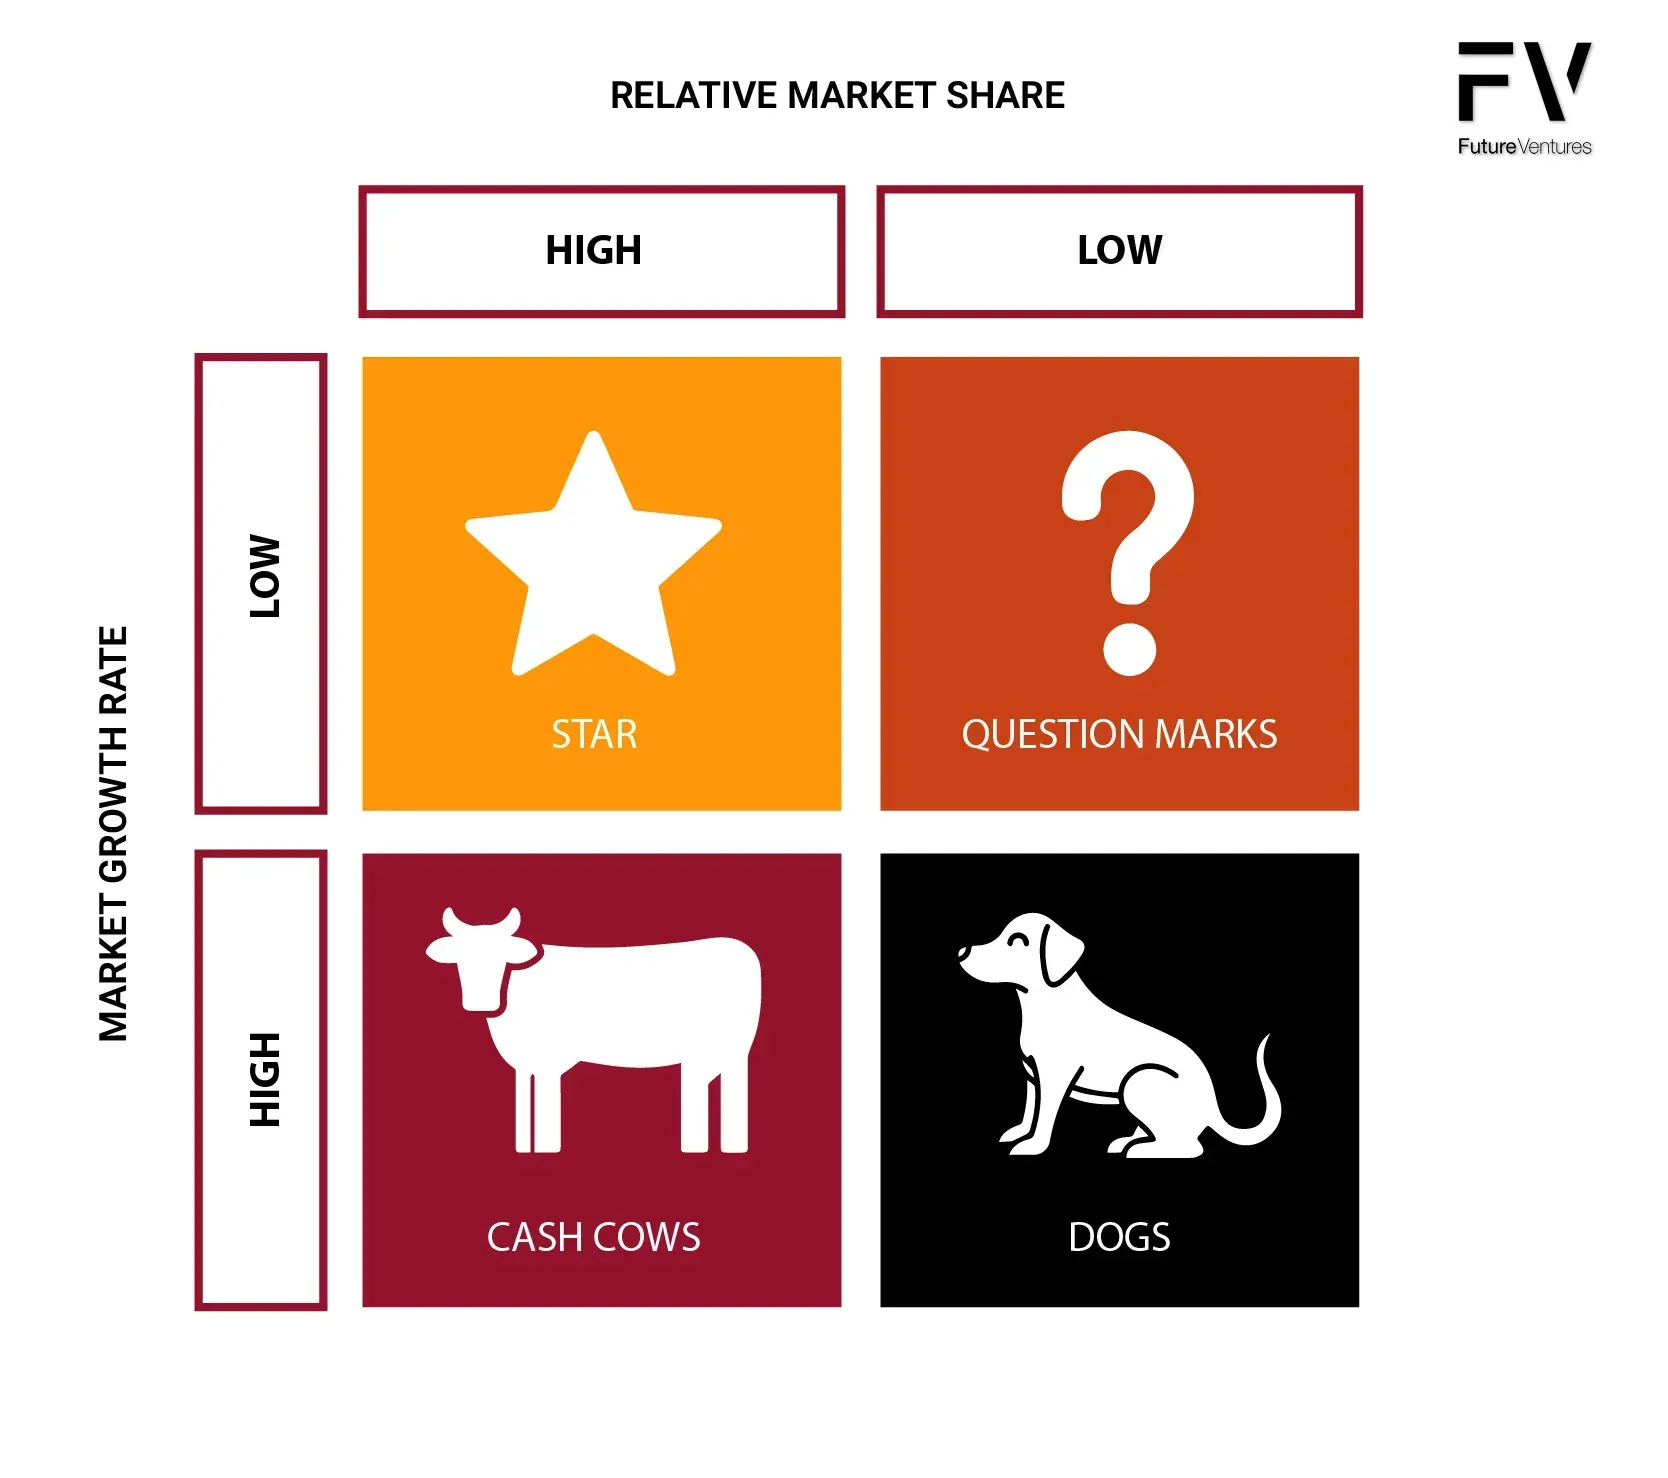
Axes you’ll actually use:
- Market Growth Rate (y-axis): growth of the served market for that product.
- Practical Cut: “high growth” = above your company's CAGR target or GDP by at least 3–5 percentage points.
- Relative Market Share (x-axis): your share divided by the largest competitor’s share.
- Formula: Relative Market Share (RMS) = Your Share ÷ Leader’s Share. >1 means you’re the leader.
- Key characteristics of RMS:
- If RMS > 1.0: Your company is the market leader
- If RMS < 1.0: Your company is not the market leader
- The dividing line in the BCG matrix is typically set at RMS = 1.0
- Why RMS matters in the BCG Matrix:
- It determines whether a business unit falls on the "high" or "low" market share side of the matrix
- High RMS suggests competitive advantages like economies of scale, cost advantages, and market power
- Low RMS indicates you're following competitors rather than leading the market
- Example: If your company has 30% market share and the largest competitor has 20% market share: RMS = 30% ÷ 20% = 1.5 (indicating market leadership). If your company has 15% market share and the largest competitor has 40% market share: RMS = 15% ÷ 40% = 0.375 (indicating you're not the market leader)
- This relative measurement is more meaningful than absolute market share because it shows your competitive position relative to the strongest player in the market, which is crucial for understanding your strategic position and cash flow potential.
The Four Quadrants (and what you do about them)
| Quadrant | What it is | Typical Cashflow | Your Default Move |
|---|---|---|---|
| Stars (High Growth, High Share) | Leaders in fast-growing markets | Cash hungry (growth soaks capital) | Invest to dominate, protect share, scale ops |
| Cash Cows (Low Growth, High Share) | Mature markets you dominate | Cash rich (high margins, steady) | Milk efficiently, defend profitability, fund the rest |
| Question Marks (High Growth, Low Share) | Attractive markets where you’re small | Cash hungry (uncertain path) | Place selective bets or kill fast - no “eternal maybe” |
| Dogs (Low Growth, Low Share) | Stagnant markets where you’re weak | Cash neutral/negative | Exit, harvest, or niche - do not feed |
The BCG Growth–Share Matrix Rules of thumb (that save real money):
- If a Question Mark isn’t on a 6–12 month path to a defensible edge, shrink or sell.
- Stars without unit economics discipline turn into bonfires. Treat growth like a privilege, not a right.
- Cows deserve ops excellence: SKU simplification, automation, price-pack architecture, and ruthless cost control.
- Dogs are not pets. Harvest, sunset, or offload.
Mini-playbook to build your BCG view:
- Define the “market” per product (your served segment, not the entire world).
- Estimate competitor shares (triangulate: public data, channel intel, customer interviews).
- Compute RMS; mark the leader at 1.0.
- Tag the growth rate of each market (YoY).
- Plot, then assign actions per quadrant with owners & budgets.
- Review quarterly; move tiles as data changes.
The GE-McKinsey Matrix
The GE-McKinsey Matrix (also called the Nine-Box Matrix or McKinsey-General Electric Matrix) is a strategic planning tool developed by McKinsey & Company for General Electric in the 1970s. It's a portfolio analysis framework used to evaluate business units and make investment decisions.
Structure: The matrix is a 3×3 grid with nine cells, plotting business units along two dimensions:
- X-axis: Industry Attractiveness (Low, Medium, High)
- Y-axis: Business Unit Strength/Competitive Position (Low, Medium, High)
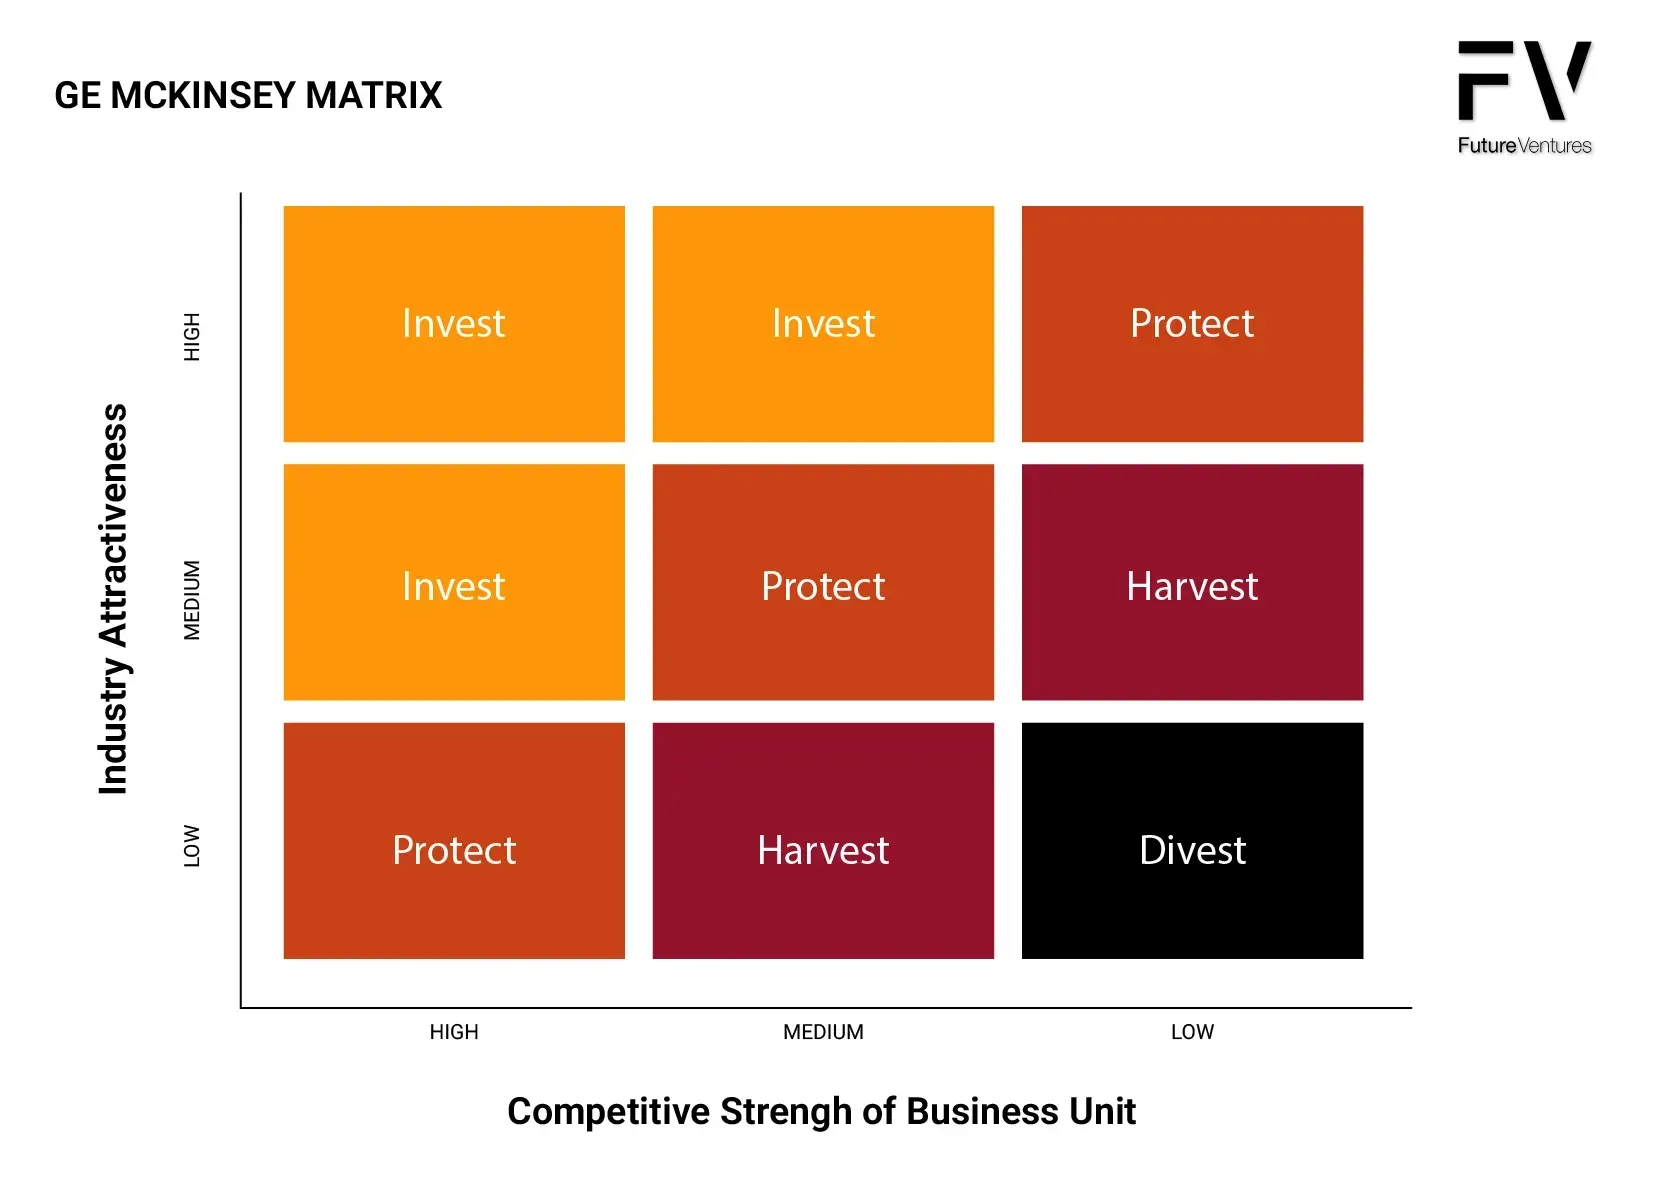
Key Factors for the GE-McKinsey Matrix:
1.Industry Attractiveness includes:
- Market size and growth rate
- Competitive intensity
- Profit margins
- Regulatory environment
- Economic and political factors
- Technological requirements
2.Business Unit Strength includes:
- Market share and position
- Brand strength
- Cost position
- Management capabilities
- Distribution channels
- R&D capabilities
Strategic Implications for the GE-McKinsey Matrix:
- High Attractiveness + High Strength (Top-right): Invest and grow
- Medium combinations: Selective investment based on specific circumstances
- Low Attractiveness + Low Strength (Bottom-left): Harvest or divest
Advantages over BCG Matrix:
- Uses multiple factors rather than just two variables
- More nuanced analysis with nine categories instead of four
- Better suited for complex, diversified companies
- Allows for more sophisticated strategic recommendations
Applications of the GE-McKinsey Matrix:
- Portfolio planning for large corporations
- Resource allocation decisions
- Strategic investment prioritization
- Business unit evaluation and restructuring decisions
The matrix enables managers to make more informed decisions about where to invest, maintain, or divest business units, taking into account both external market conditions and internal competitive capabilities.
Part IV. Ansoff vs. BCG (and how each earns its keep)
| Dimension | Ansoff Matrix | BCG Growth–Share |
|---|---|---|
| Core question | How will we grow? | Where do we fund? |
| Unit of analysis | Company/product strategic move | Product line/business unit |
| Axes | Product (existing/new) × Market (existing/new) | Market growth × Relative market share |
| Output | Growth strategy portfolio | Capital allocation & lifecycle posture |
| Time horizon | 12–36 months (strategy & GTM) | 6–18 months (budget & ops) |
| Typical pitfalls | Over-diversifying, vague ICPs | Funding “dogs,” coddling “question marks” |
| Best together | Use Ansoff to choose plays, BCG to fund and sequence them |
👉 Takeaway: Ansoff is your “where to expand” compass. BCG is your “fuel the winners” wallet. Use both. One without the other is a plan without gas or a budget without a plan.
Part V. Build Your Product–Market Focus Matrix (operationalizing strategy)
This is the “no-excuses” grid: products (rows) × segments/regions (columns) with a focus decision in each cell.
Example Product-Market Focus Matrix structure:
| Product / Segment | Core ICP | Enterprise | SMB | EU | APAC |
|---|---|---|---|---|---|
| Platform A | Invest | Hold | Harvest | Invest | Hold |
| Add-on B | Hold | Invest | Exit | Hold | Exit |
| Service C | Harvest | Harvest | Exit | Exit | Exit |
For each Invest cell, add:
- Owner; Budget; Thesis; 3 KPIs (e.g., CAC payback ≤ 12 mo, NRR ≥ 115%, Sales cycle ≤ 60 days); Kill-switch.
👉 Takeaway: This matrix forces trade-offs. If everything is “Invest,” nothing is.
Part VI. Applying the Matrices (with real-world colour)
Market Penetration → Cash Cow upgrade
- You underprice a dominant product, add self-serve onboarding, and squeeze CAC payback to < 9 months. The product stabilizes as a Cash Cow—funding Stars and bold bets.
Product Development → Star creation
- You launch a data add-on for the same ICP with a 30% attach rate. In a fast-growing category, that add-on becomes a Star and pulls the platform with it.
Market Development → bet the channel
- Same product, new vertical with a partner-led motion. If the relative share climbs quickly, it graduates from Question Mark to Star; if not, you harvest and redeploy.
Diversification → only with edge
- You spin up a new line that leverages unique assets, such as distribution, proprietary data, or brand permission. If you can’t name the edge in one sentence, don’t diversify yet.
Part VII. Metrics That Matter (so you don’t fly blind)
Track these per product/market cell:
- Market growth (YoY) and Relative Market Share (RMS)
- Unit economics: Gross margin, CAC payback, LTV/CAC, Contribution margin
- Durability: NRR, Churn, NPS/CSAT, Price realization
- Go-to-market velocity: SQL→Win rate, Sales cycle length, Partner-sourced %
- Focus signal: Resource ratio (R&D + Sales & Marketing) vs revenue trend
Decision Heuristics:
- Promote to “Star” if RMS > 0.7 and market growth is in the top quartile and CAC payback ≤ 12 months.
- Graduate to “Cash Cow” when growth normalizes, but retention and margins remain strong.
- Cull “Dogs” if RMS < 0.3, growth bottom quartile, and contribution margin < 0 for 2 consecutive quarters without a credible turnaround plan.
- Flip “Question Marks” into high-conviction experiments with time-boxed funding and pre-agreed kill-criteria.
Part VIII. Side-by-Side: BCG vs. Ansoff vs. GE–McKinsey
| Use Case | Ansoff | BCG | GE–McKinsey |
|---|---|---|---|
| Pick a growth move | ✅ | – | – |
| Allocate budget | – | ✅ | ✅ |
| Compare markets, by attractiveness | – | – | ✅ |
| Communicate portfolio to the Board | ✅ | ✅ | ✅ |
You don’t need all three every quarter. Most scale-ups win with Ansoff (choose plays) + BCG (fund plays), and pull GE–McKinsey only when you’re weighing many markets with complex, multi-factor attractiveness. The Matrix is often used in conjunction with other analysis frameworks, such as SWOT and PESTEL, to provide a comprehensive strategic view.
Part IX. The Futurist Lens: How These Matrices Evolve? How Should You Adapt?
- AI-Native Products: Features become mini-products; expect a feature-level BCG, deciding which AI copilots are Stars vs. Dogs based on usage and willingness to pay.
- Data Network Effects: Growth is less about markets and more about graph density. Consider adding “flywheel strength” as a third dimension to BCG decisions.
- Bundling Returns: Expect ARPU-driven product development - micro-bundles that move you from app to platform and platform to ecosystem.
- Sustainability & Regulation as Axes: In certain categories, regulatory tailwinds and carbon economics will matter as much as raw growth; build them into your Market Matrix.
- Dynamic Pricing & Usage: Your Product Matrix should include monetization models (seat, usage, outcome) and elasticity tests. Winners will treat pricing as a product.
- Geography Reimagined: “Markets” shift from physical regions to networks (e.g., marketplace buyers, developer communities). Your Market Development may be, in practice, Network Development.
Part X. Implementation: 8-Step Operating Rhythm
- Map the portfolio (products, modules, services).
- Build your Market Matrix (size, growth, regulation, competition, margin potential).
- Run BCG for each product in each defined market. Assign Star/Cow/Question/Dog and default moves.
- Choose Ansoff plays per product line (the how).
- Create the Product–Market Focus Matrix with Invest/Hold/Harvest/Exit decisions per cell, plus owner, KPIs, and budget.
- Fund the plan: shift OPEX/CAPEX to Stars and high-conviction Question Marks; lock harvest targets for Cows; schedule sunsets for Dogs.
- Quarterly review: move tiles, publish a one-page “capital letter” to your team explaining shifts and kill-decisions. Transparency compounds trust.
- Model growth drivers effectively: High-quality due diligence includes accurately modelling the factors that drive growth, ensuring strategic decisions are based on robust data and insights.
Governance that prevents drift:
- One-way door: Exits and sunsets need CEO sign-off.
- Two-way door: Pricing tests, channel experiments, and feature flags can be delegated.
- Stoplight review: Green (invest more), Yellow (hold/learn), Red (kill/harvest).
Part XI. Practical Templates (copy/paste)
A) Ansoff Matrix (fill in with your bets)
| Existing Market | New Market | |
|---|---|---|
| Existing Product | Market Penetration: [tactics, KPI, owner] | Market Development: [geo/segment, localization, partner] |
| New Product | Product Development: [attach rate target, ARPU impact] | Diversification: [edge thesis, budget, kill-switch] |
B) BCG Growth–Share Summary
| Product | Market | Growth (YoY) | RMS | Quadrant | Decision | Budget Δ | Owner |
|---|---|---|---|---|---|---|---|
| Platform A | Core SMB | 6% | 1.4 | Cash Cow | Harvest 10% OPEX | −10% | Ops |
| Add-on B | Data Services | 24% | 0.8 | Star | Invest in PLG + Sales | +25% | GM |
| Module C | Enterprise EU | 18% | 0.3 | Question Mark | 2 experiments, 2 quarters | +10% | VP EMEA |
| Legacy D | On-prem | 1% | 0.2 | Dog | Sunset in 9 months | −100% | CTO |
C) Product–Market Focus Matrix (ops view)
| Product / Segment | ICP Core | Enterprise | Mid-Market | SMB | Channel |
|---|---|---|---|---|---|
| Core Platform | Invest | Hold | Invest | Harvest | Hold |
| Analytics Add-on | Hold | Invest | Hold | Exit | Invest |
Part XII. Horizontal Diversification: The Overlooked Growth Lever
What is Horizontal Diversification?
Horizontal diversification is a growth strategy that expands your company’s product or service offerings into new markets or customer segments while staying within your core industry. Think of it as broadening your product range to reach new customers, without straying too far from what you already know. Unlike vertical diversification, which takes you into entirely new industries or supply chains, horizontal diversification leverages your existing market knowledge, customer base, and operational strengths.
For example, a software company that sells project management tools to tech startups might launch a similar tool tailored for marketing agencies or HR teams. You’re not reinventing the wheel; you’re rolling it into new territory. The Ansoff Matrix emphasises horizontal diversification as a strategy to grow market share and reach new customer segments, while leveraging your existing expertise. Of course, every growth strategy comes with potential risks, so it’s critical to evaluate whether expanding your product range aligns with your business’s strengths and market realities.
When and Why to Use Horizontal Diversification?
Horizontal diversification is ideal when growth in existing markets slows or when you want to reduce dependence on a single product or customer segment. It’s effective for entering new regions or targeting similar market segments with related needs. Market research helps identify growth opportunities and validate demand. This strategy can boost market penetration, enhance customer loyalty, and open new revenue streams by leveraging existing products and market knowledge to serve adjacent segments.
Risks and Rewards
Horizontal diversification can unlock major growth opportunities, but it’s not without its challenges. This strategy often requires a significant investment in marketing, sales, and product development to reach new customer segments and successfully expand your market share. One key risk is cannibalization. Your new offerings might eat into sales of your existing products. You’ll also face increased competition and may need to adjust your pricing strategies to appeal to different market segments.
On the flip side, the rewards can be substantial. When done right, horizontal diversification can accelerate market expansion, enhance profitability, and strengthen your competitive position. It’s a way to future-proof your business by spreading risk across a broader product market and meeting evolving customer needs. The product market expansion grid is a powerful tool for evaluating various growth strategies, enabling business leaders to weigh potential risks and rewards before committing resources. By aligning your diversification efforts with your company’s established strengths and the needs of new customer segments, you can maximize the upside while managing the downside.
Part XII. Coaching Notes
- If everything is a priority, nothing is a priority and you have no strategy. Your Focus Matrix should make you uncomfortable; that’s how you know it’s real.
- Don’t confuse TAM with a right to win. If you can’t state your edge in a tweet, you don’t have one.
- Promotion ≠ traction. Put CAC payback and retention at the center of every growth bet.
- Diversification is a tax on the undisciplined. Earn the right by proving repeatability in one market first.
- Kill quickly, celebrate publicly. Sunsets free oxygen for Stars.
Part XIII. FAQ: direct answers to your specific asks
What is the Product–Market Matrix?
It’s the
Ansoff Matrix—a 2×2 matrix (existing vs. new products and existing vs. new markets) used to select market penetration, product development, market development, or diversification as your growth strategy. The product market matrix enables businesses to identify their target customers and align their strategies accordingly.
What is a Product Matrix?
A portfolio table showing
your products/SKUs vs attributes/personas/tiers. It clarifies overlap, gaps, and monetization paths.
What is the Product–Market Focus Matrix?
An execution grid of
products vs segments with a
focus decision (Invest/Hold/Harvest/Exit) in each cell, including
owner, KPIs, budget, and kill criteria.
What is a Market Matrix?
A table comparing
markets/segments across
attractiveness (size, growth, margin, regulation) and
your position (share, edge). You can use a simple score or a nine-box (GE–McKinsey) to prioritize.
What is the BCG Product–Market Growth (Growth–Share) Matrix?
A 2×2 that classifies each product/business by
Market Growth and
Relative Market Share into
Stars, Cash Cows, Question Marks, and Dogs to guide
capital allocation:
- Stars: high growth, high share → Invest to dominate.
- Cash Cows: low growth, high share → Harvest to fund others.
- Question Marks: high growth, low share → Bet selectively or exit.
- Dogs: low growth, low share → Exit/harvest/niche.
How does BCG compare to Ansoff?
Ansoff tells you
which growth move to pursue; BCG tells you
how to fund your portfolio
now. Use the Ansoff matrix to choose plays, and the BCG matrix to allocate cash and attention.
Final Takeaways (put this into motion)
- This week: draft your Product–Market Focus Matrix with honest Invest/Hold/Harvest/Exit calls.
- This month: compute RMS and market growth for each product, then publish your BCG portfolio with budgets.
- This quarter: pick 1–2 Ansoff plays with real KPIs and kill-switches. Review progress in 90 days.
- This year: earn the right to diversify by elevating one product from Question Mark → Star → Cow.
You don’t need another brainstorming session. You need a clear matrix of choices, money behind the right ones, and the courage to say no. That’s how you scale, on purpose.
Related Insights and Thought Leadership to Explore